Study the characteristics of strain gauge.
Setup:
The setup consists of two things.
Strain gauge module
And the signal conditioning and processing unit.
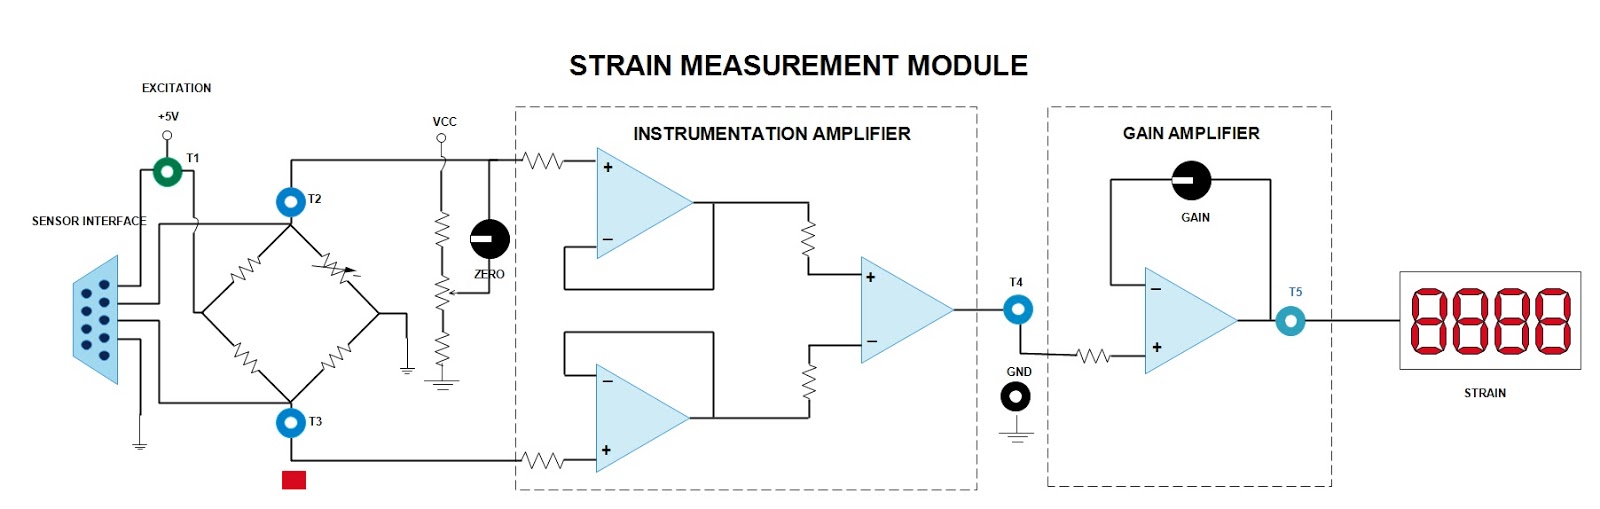
The strain gauge module consists of a cantilever beam which is fixed on a rigid body. Four strain gauges are placed on the surface of the beam. Two strain gauges are placed over the beam and two are beneath the beam. A D9 connector connects the strain gauges with the signal conditioning unit. There is a hook which is attached to the cantilever beam, through which the load is applied to the beam. In signal conditioning circuit there is a instrumentation amplifier and a gain amplifier with some associated circuit which calibrates the load in terms of micro strain with the help of zero and gain adjustment pot. A four digit seven segment display is provided, that displays the amount of load in terms of micro strain.

Working:
The four strain gauges which are fixed with the cantilever beam makes four arm of a wheat stone bridge, making it a full bridge. The strain gauges which are fixed above the beam detects the longitudinal strain and which are fixed below the beam detects transverse strain. When the load is applied on the end of the beam, a downward force is exerted. It tends to change the dimension of the beam. This dimensional changes are sensed by strain gauges fixed with the beam. A strain occurred on the beam is calculated by the given formula.
Strain = 6PL/Bt2Y
Where
P = Applied load in Kg.
L = Length of the beam in cm. = 21.58cm
B = Breadth of the beam in cm. = 2.8cm
t = Thickness of the beam in cm. = 0.25cm
Y = Young’s modules of the material to be used in Kg/cm2. = 2X10⁶
The resistances of the strain gauges are changed due to the dimensional changes in beam when the load is applied. Due to this resistance changes an unbalanced voltage is developed in the bridge output. This unbalanced voltage are further processed and calibrated to give the strain directly on the display.
Experiment 1: To study the characteristics between strains applied to the cantilever beam strain sensor and the bridge voltage.
Apparatus required:
Multimeter.
Weights (100 grams X 10 Nos)
Procedure:
- Connect the hook on the cantilever beam and interface the 9 pin D connector with the kit.
- Switch ON the module.
- Initially unload the beam and nullify the bridge voltage/ strain displayed on DPM by using zero adjust pot.
- Then apply full load of 1Kg (10X100gms) and adjust the gain pot so that the display should show 370.
- Now remove all the loads and apply 100 gram note down the strain displayed and measure the bridge voltage (mV) across T2 and T3.
- Gradually increase the load 100gm in step on the beam and note down applied load and the bridge voltage (mV).
- Tabulate the values of applied load, theoretical strain and the bridge voltage (mV).
- Plot a graph between theoretical strain versus bridge voltage (mV).
Observation:
Sl no.
|
Applied load (gm)
|
Theoretical Strain (µs)
|
Bridge Voltage (mV)
|
Experiment 2: To study the characteristics between strain applied to the cantilever beam and the signal conditioned output voltage.
Apparatus required:
Multimeter
Weight ( 100 gms x 10 Nos)
Procedure:
- Connect and Calibrate the setup as per the procedure mentioned in the experiment 1.
- Connect the multimeter in Volt mode across T5 and GND for the signal conditioned sensor voltage measurement.
- Now apply the load 100 gms in step and note down the signal conditioned output voltage and actual strain displayed for each load.
- Tabulate the values of theoretical strain, actual strain,signal conditioned output voltage, applied load and % error.
- % error = actual strain – theoretical strain X 100Theoretical Strain
- Plot the graph between theoretical strain and signal conditioned output & % error versus theoretical strain.
Observation:
Sl no
|
Applied load (gm)
|
Theoretical strain (µS)
|
Actual strain (µS)
|
Signal conditioned output voltage
|
% Error
|
* Theoretical strain should be in X-axis of the graph
Study the characteristics of load cell
Setup:
The setup consists of a load cell transducer and its signal conditioning circuitry. The load cell is a cantilever beam type load cell. Here four bonded metal strain gauges are fixed with the cantilever beam. The measuring range is up to 5Kg with resolution of 0.01Kg.four terminals are taken out to connect the load cell with the signal conditioning circuit. All four strain gauges are connected to form a four arm active Wheatstone Bridge. In the signal conditioning circuit there is an excitation source that generates 5V DC for the circuit to work. An Instrumentation amplifier and Inverting summing amplifier with zero and gain adjustment for signal processing and calibration purpose. A 3 ½ digit LED display unit for displaying the load in Kg.

Working:
Load cell is an electro mechanical sensor used to measure static and dynamic force. It is designed to handle a wide range of operating forces with high level of reliability. When the load is put over the load cell the deformation is sensed by the strain gauges. All the strain gauges are suitably located so that the output strain is linearly proportional to the input force with minimum hysteresis and creep. The deformation sensed by the strain gauges causes a change in output voltage of Wheatstone bridge which is then further processed and calibrated to display the load value directly in Kg.

Apparatus required:
Weight ( 1Kg X 5 Nos)
Procedure:
- Connect the four terminals of the load cell with the four arms of the Wheatstone bridge according to their color.
- Connect the output of adder block to the display unit with a patch cord.
- Switch ON the power supply.
- Remove all the loads from the load cell and adjust the zero POT to show zero reading on the display.
- Now put 5Kg weights on the pan of the cantilever beam and adjust span POT to show 5Kg reading on display.
- Then apply loads 500gms in step and note down the readings in the following table in increasing and decreasing mode.
- Plot the graph between applied load and displayed load in Kg and measure the hysteresis error.
Observation:
Sl no
|
Load increasing mode
|
Load decreasing mode
|
||
Load(Kg)
|
DPM reading(Kg)
|
Load (Kg)
|
DPM reading (Kg)
|
|
Good application for case study, maybe you should more think strain gauge theory
ReplyDeleteThis blog is very nice u must be read a load cell is a sensor that converts force or weight into an electrical signal.
ReplyDelete